Funky Time History: Live Results Tracker
Funky Time Statistic offers an approach, to data analysis by blending statistical techniques with a touch of fun and creativity. This method aims to make data interpretation more user friendly and enjoyable catering to an audience. The article delves into the concepts of Funky Time Statistic highlighting its advantages and showcasing real world instances of its usage.
| Date | Spin Results | Multiplier | Payout | Winners | Top Winner | Bonus Round |
|---|
New in Funky Time?
Participate in an engaging workshop, about the fascinating realm of Funky Time Statistics! In this video we will walk you through how to interpret and leverage game statistics to improve your betting tactics.
How to Read the Funky Time Statistics
Funky Time consists of components, each corresponding to specific symbols or letters on its dial. It's important to grasp the distribution and likelihood of these components, for interpreting the information. We used images as a reference guide:
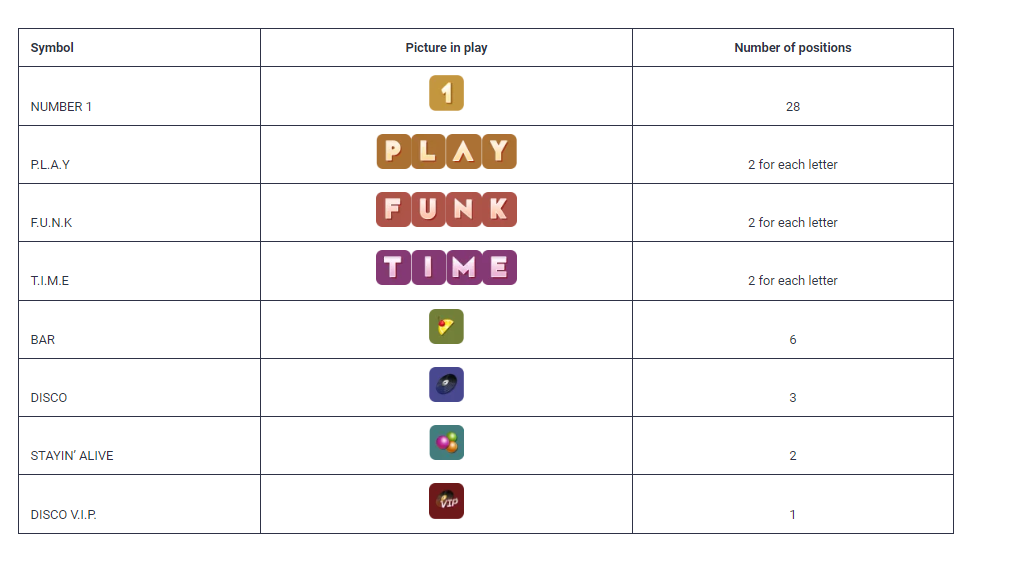
Number 1
- Occurrences: 28 positions on the wheel.
- Frequency: This particular section is most likely to be successful, with a 43.75% likelihood. It usually results in a reward but is the one that players land on most often.
Letters
- P.L.A.Y: Each letter (P, L, A, Y) appears 2 times on the wheel.
- F.U.N.K: Each letter (F, U, N, K) also appears 2 times.
- T.I.M.E: Each letter (T, I, M, E) appears 2 times.
- Total Letter Segments: 24 positions.
- Frequency: The likelihood of each group of letters appearing is around 12.5%, which represents a probability.
Bonus Segments
- BAR: Players can land on six spots with a chance of 9.375%. This activates a round that gives rewards to players, including multipliers.
- DISCO: There are 3 spots with a probability of around 4.6875%. This leads to a bonus round where Mr. Funky dances on the dance floor.
- STAYIN' ALIVE: With 2 spots and a chance of about 3.125% players enter a bonus round where they climb up a ladder.
- DISCO V.I.P: One spot has a probability of 1.5625%. It offers an upgraded version of the DISCO bonus, with multipliers.
Understanding the Statistics
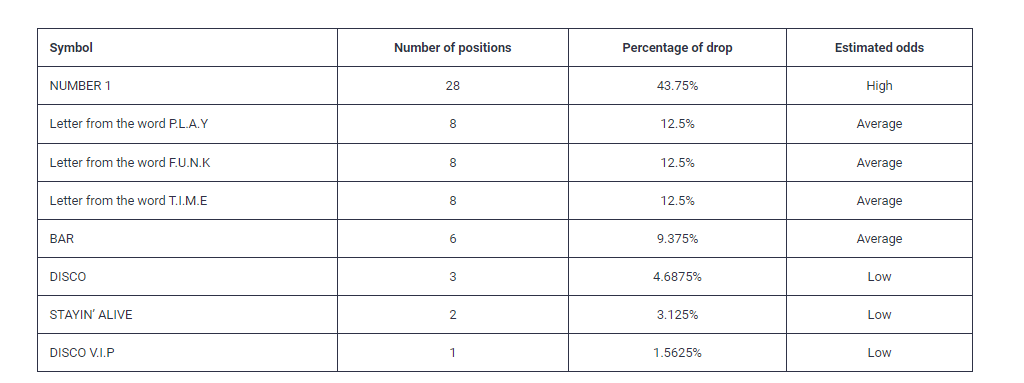
The data from the game provides us with insights into how each symbol appears on the wheel and the probability of it appearing after numerous spins.
- Symbol Frequencies: This indicates how often each symbol is seen on the wheel. For instance Symbol 1 appears 28 times.
- Landing Probabilities: This shows the likelihood of each section appearing after a spin. For example Symbol 1 has a chance of 43.75%.
- Probability Categories: These classify the likelihood of landing on a section, as High, Average or Low. For instance Symbol 1 has odds because it appears frequently.
Detailed Segment Breakdown
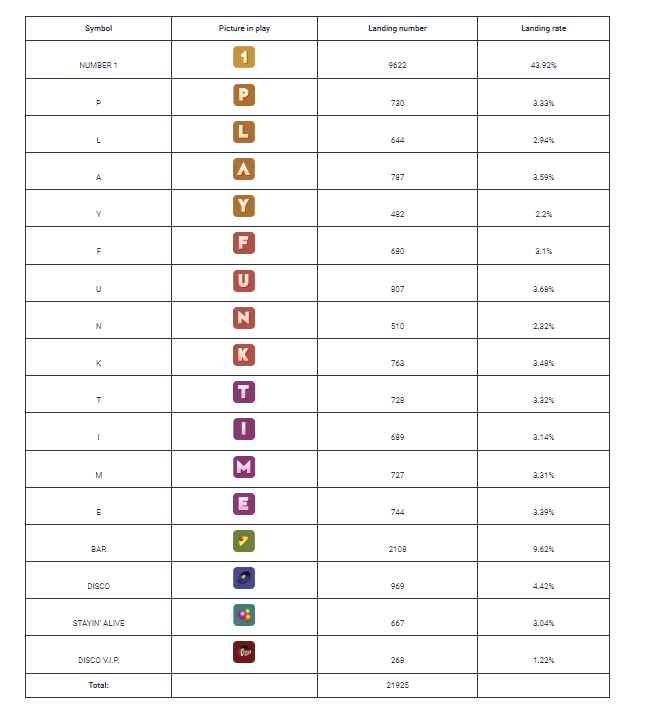
Over a sample of 21,925 spins, the landing rates are as follows:
- Number 1:
- Positions: 28
- Landing Number: 9,622
- Landing Rate: 43.92%
- Odds: High
- Letters:
- P: 2 positions, Landing Number: 780, Rate: 3.83%
- L: 2 positions, Landing Number: 644, Rate: 2.94%
- A: 2 positions, Landing Number: 787, Rate: 3.59%
- Y: 2 positions, Landing Number: 492, Rate: 2.2%
- F: 2 positions, Landing Number: 680, Rate: 3.1%
- U: 2 positions, Landing Number: 807, Rate: 3.68%
- N: 2 positions, Landing Number: 510, Rate: 2.82%
- K: 2 positions, Landing Number: 763, Rate: 3.48%
- T: 2 positions, Landing Number: 728, Rate: 3.82%
- I: 2 positions, Landing Number: 689, Rate: 3.14%
- M: 2 positions, Landing Number: 727, Rate: 3.31%
- E: 2 positions, Landing Number: 744, Rate: 3.89%
- Bonus Segments:
- BAR: 6 positions, Landing Number: 2,108, Rate: 9.62%
- DISCO: 3 positions, Landing Number: 969, Rate: 4.42%
- STAYIN' ALIVE: 2 positions, Landing Number: 667, Rate: 3.04%
- DISCO V.I.P.: 1 position, Landing Number: 268, Rate: 1.22%
How to Use the Statistics
- Identifying Segments: Segments like Number 1 are commonly seen, making them a safer bet despite offering rewards.
- Analyzing Letter Pairings: Understanding the frequency of letter combinations can be useful for placing bets with a moderate level of risk and potential gains.
- Targeting Bonus Opportunities: Bonus segments such as BAR, DISCO and STAYIN' ALIVE carry the potential for rewards albeit, with varying chances of appearing. Utilize the data to assess the likelihood of these segments appearing.
Practical Application
When placing bets it's good to take these statistics into account to help you make decisions:
- For wins: Consider betting on sections that have a higher likelihood of winning, like Number 1.
- For a blend of risk and reward: Contemplate wagering on letter divisions, with probabilities.
- For both risks and rewards: Explore bonus sections even if they offer odds.
By utilizing these statistics players can enhance their decision making in gaming. Enhance their overall enjoyment.
The Expected Results
For easier mastering of information about statistics, we have prepared a table:
| Segment on Wheel | Number of Segments | Chance to Hit | Spins Between Hits | RTP | Average Win |
|---|---|---|---|---|---|
| Number 1 | 28 | 43.75% | 2-3 | 95.99% | 1:1 |
| Letters (P.L.A.Y) | 8 (2 each) | 12.5% | 8 | 95.50% | 25:1 |
| Letters (F.U.N.K) | 8 (2 each) | 12.5% | 8 | 95.50% | 25:1 |
| Letters (T.I.M.E) | 8 (2 each) | 12.5% | 8 | 95.50% | 25:1 |
| BAR | 6 | 9.38% | 11 | 95.30% | ~2x to 20x, plus multiplier |
| DISCO | 3 | 4.69% | 21 | 95.20% | ~1x to 500x, plus multiplier |
| STAYIN' ALIVE | 2 | 3.13% | 32 | 95.10% | Up to 10,000x |
| DISCO V.I.P. | 1 | 1.56% | 64 | 95.05% | Up to 10,000x |
FAQ
Understanding the data, on Funky Time can help you make betting decisions and improve your strategy.
Trackers can help identify patterns and trends, potentially improving your betting outcomes.
Yes, using trackers can provide insights into game trends and help refine your betting strategy.
Utilize game stats, trackers. Grasp the likelihood of each section to improve your betting decisions.
The numbers come from how the game works and apply everywhere in all casinos that offer Funky Time.